Turn a long list into a clear summary
A pivot table groups and totals your data without a single formula. Choose the fields for rows, columns and values, and SheetsBat builds the summary next to your data and keeps it in step.
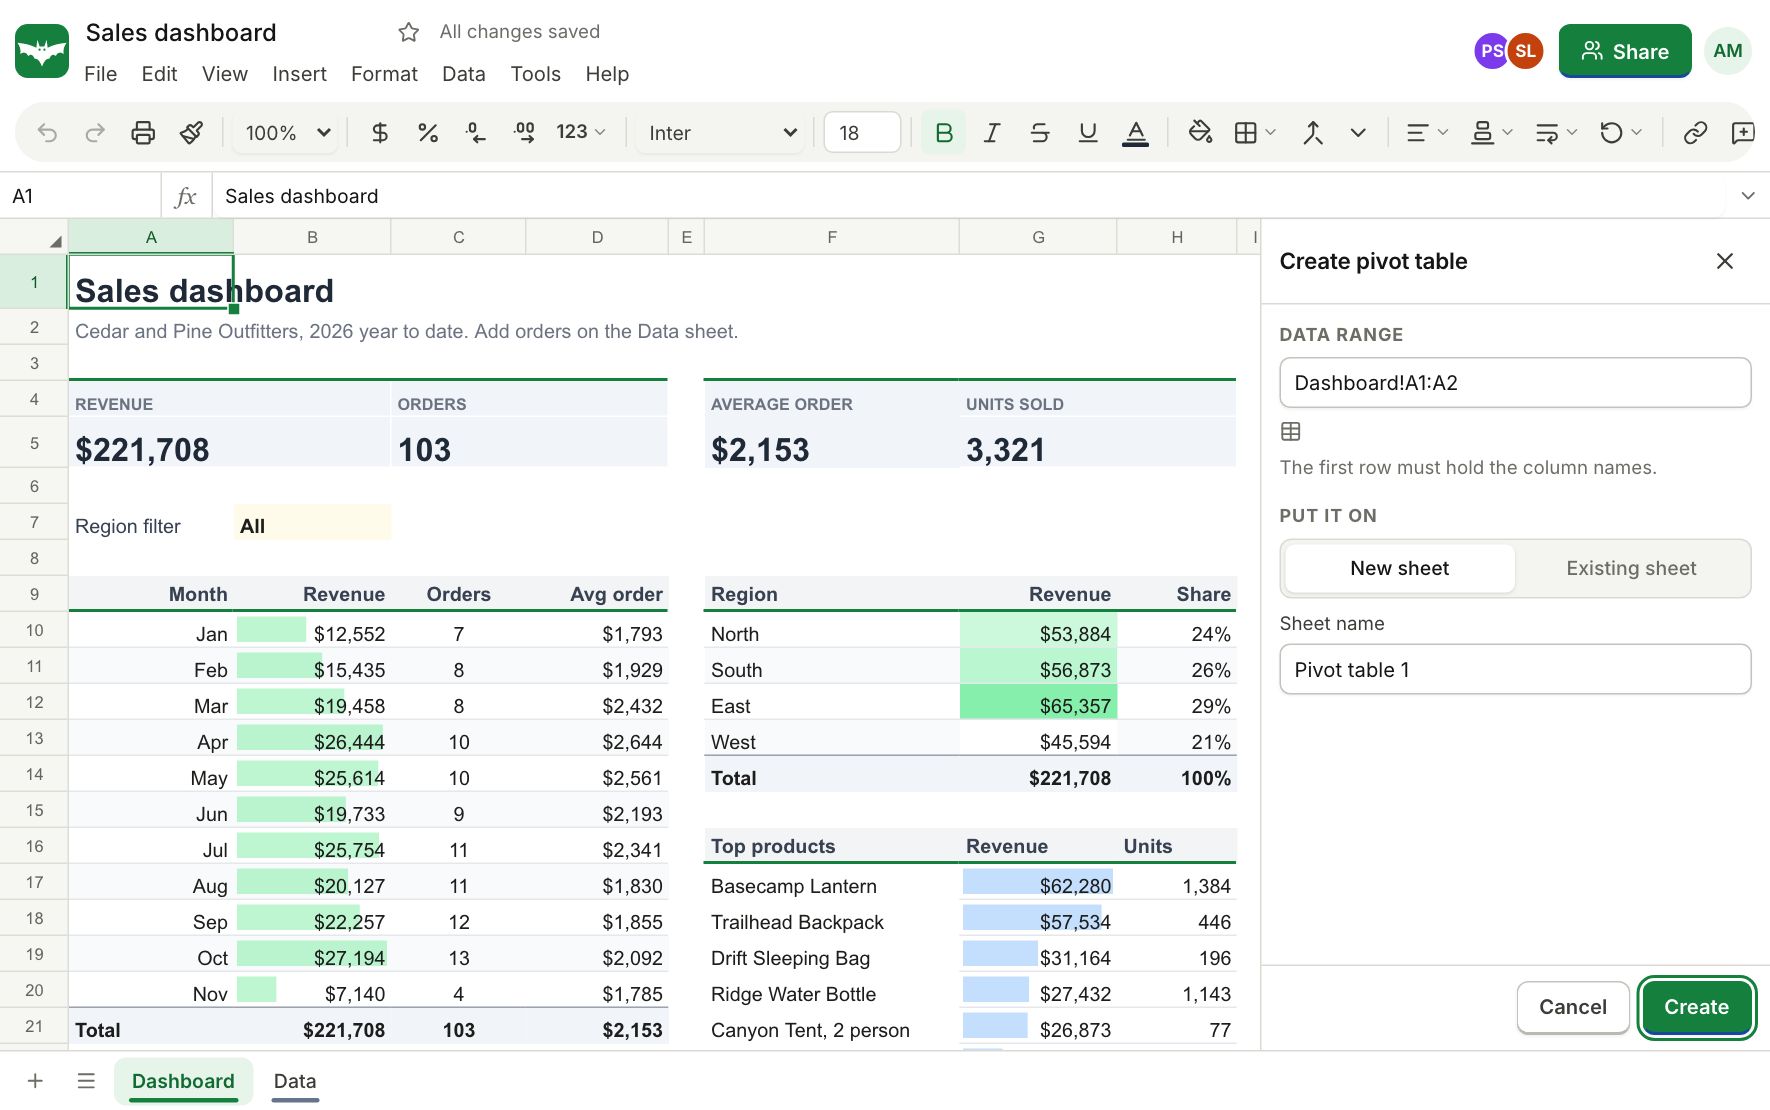
Rows, columns, values and filters
Put a field in rows to list its values, in columns to spread them across, and in values to total them. Filters narrow the summary to just the items you want.
- Sum, count, average, min, max, product, standard deviation and variance
- Show values as a percent of the grand total, the row or the column
- Group dates by year, quarter, month or day
- Sort by label or by value, with grand totals for rows and columns
Formulas when you prefer them
GROUPBY and PIVOTBY build the same kind of summary inside a single formula, and GETPIVOTDATA reads a value from a pivot table into another cell.
Charts and dashboards
Point a chart at a pivot table to visualize it, or reference its cells from a dashboard sheet.
Questions about pivot tables
How do I create a pivot table?
Select your data, including the header row, and choose Insert, Pivot table. Then pick fields for rows, columns and values.
Does a pivot table update when the data changes?
Yes. The summary is recalculated from the source range whenever it changes.
Can I group dates by month?
Yes. Date fields can be grouped by year, quarter, month or day.
Can I chart a pivot table?
Yes. Select the pivot table output and insert a chart, or reference its cells from a dashboard sheet.
Is there a limit on rows?
Free workbooks hold up to 500,000 filled cells and Pro workbooks up to 5 million.
Keep exploring
- ChartsColumn, line, pie, combo, scatter, waterfall, funnel, treemap and more. Charts sit on the sheet, update as numbers change and export with the workbook.
- FormulasWrite formulas the way you already know: XLOOKUP, FILTER, SUMIFS, LET, LAMBDA and 536 functions in all, with spilling arrays, tables and named ranges.
- Conditional formattingHighlight what matters with colour scales, data bars, icon sets and formula rules, and keep entries clean with dropdowns, checkboxes and validation rules.
See it for yourself
Open a blank sheet or a template. No account needed to try it.