Charts that keep up with your numbers
Select a range and insert a chart. It sits on the sheet next to the data, updates the moment a number changes, and goes with the workbook when you download it.
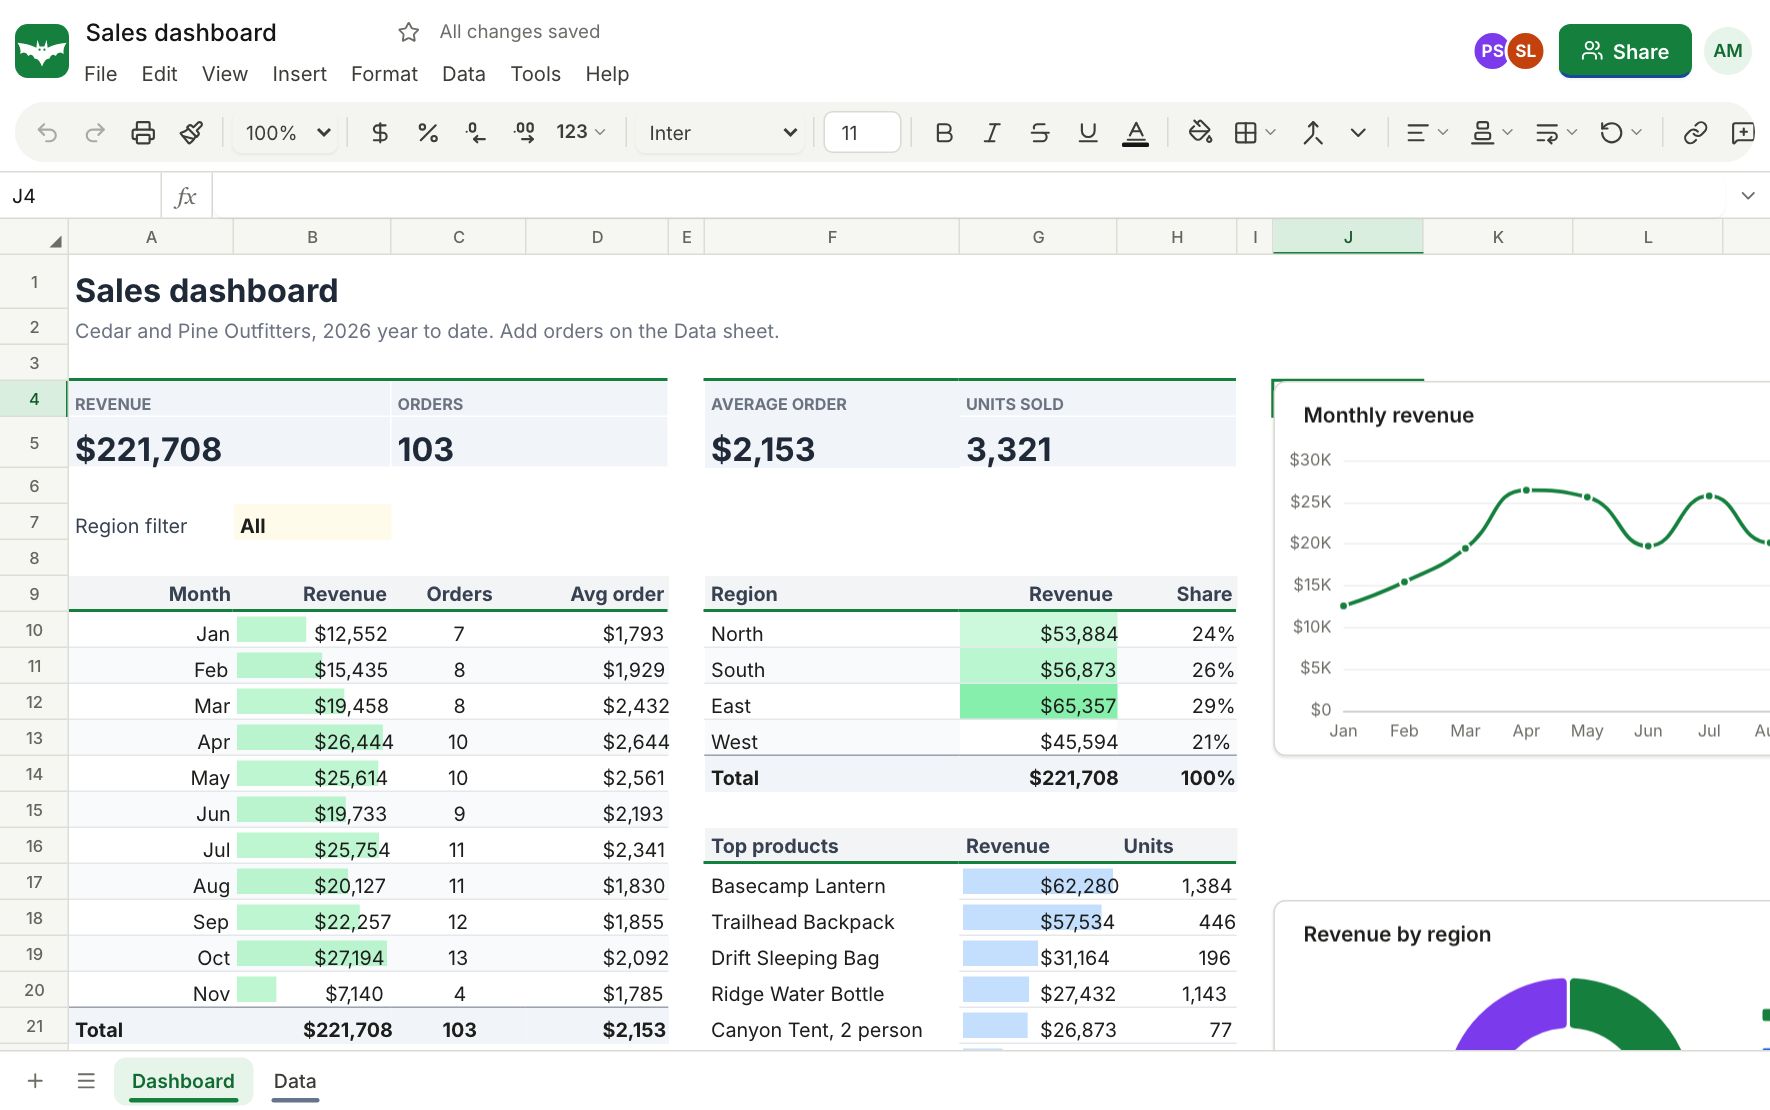
14 chart types
Pick the chart that tells the story.
- Column, bar, line and area, stacked or 100% stacked
- Pie and doughnut
- Scatter and bubble
- Combo charts with a second axis
- Radar, histogram, waterfall, funnel and treemap
Make it yours
Set the title and subtitle, axis titles and bounds, legend position, data labels, smooth lines and series colours. Move and resize a chart on the sheet like any other object.
Built for dashboards
Combine charts with formulas, conditional formatting and dropdowns to build a dashboard that answers questions at a glance. Several templates, like the sales dashboard and the KPI dashboard, show how.
Questions about charts
Do charts update automatically?
Yes. A chart reads its range every time the data changes, including values calculated by formulas.
Are charts saved with the workbook?
Yes. Charts are part of the workbook, so they are there for everyone you share it with and every time you open it.
Which chart types are available?
Column, bar, line, area, pie, doughnut, scatter, bubble, combo, radar, histogram, waterfall, funnel and treemap.
Can a chart use data from another sheet?
Yes. Series can point at ranges on any sheet in the workbook.
Are charts on phones too?
Yes. Charts render on phones and tablets, and you can open their settings from the sheet.
Keep exploring
- Pivot tablesDrag fields into rows, columns and values to summarize data by region, month or product. Sum, count, average, percent of total and date grouping.
- Conditional formattingHighlight what matters with colour scales, data bars, icon sets and formula rules, and keep entries clean with dropdowns, checkboxes and validation rules.
- TemplatesStart from a ready made budget, invoice, loan schedule, Gantt chart, dashboard or tracker. Every template is free, with working formulas and charts.
See it for yourself
Open a blank sheet or a template. No account needed to try it.