Sales template
Sales dashboard
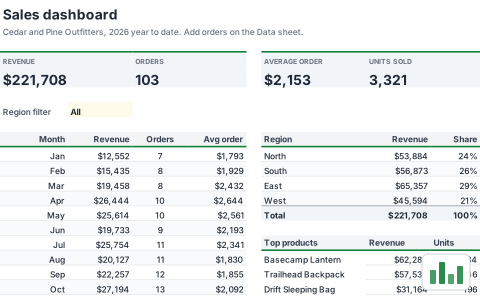
A year to date sales dashboard with revenue, orders and average order value, monthly trend, region split and top products. Add orders to the Data sheet and everything updates.
- Free
- No account needed to try
- Download as .xlsx
What's inside
Everything is a normal workbook once you open it: change the numbers, rename the sheets and make it yours.
2 sheets
- Dashboard
- Data
168 formulasTotals, lookups and checks are already worked out, so the sheet updates as you type. 936 filled cells in all.
Built in
- Charts
- Conditional formatting
- Dropdowns
- Named ranges
- Tables
- Dynamic arrays
A look at the Dashboard sheet
The top left of the first sheet, calculated by SheetsBat. Open the template to see all of it.
| A | B | C | D | E | F | G | H | |
|---|---|---|---|---|---|---|---|---|
| 1 | Sales dashboard | |||||||
| 2 | Cedar and Pine Outfitters, 2026 year to date. Add orders on the Data sheet. | |||||||
| 3 | ||||||||
| 4 | REVENUE | ORDERS | AVERAGE ORDER | UNITS SOLD | ||||
| 5 | $221,708 | 103 | $2,153 | 3,321 | ||||
| 6 | ||||||||
| 7 | Region filter | All | ||||||
| 8 | ||||||||
| 9 | Month | Revenue | Orders | Avg order | Region | Revenue | Share | |
| 10 | Jan | $12,552 | 7 | $1,793 | North | $53,884 | 24% | |
| 11 | Feb | $15,435 | 8 | $1,929 | South | $56,873 | 26% | |
| 12 | Mar | $19,458 | 8 | $2,432 | East | $65,357 | 29% | |
- sales
- dashboard
- revenue
- kpi
- charts
More sales templates
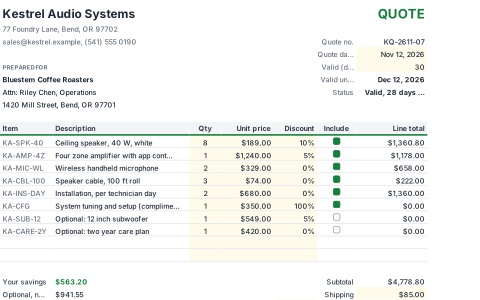 SalesSales quoteSend a professional quote with line discounts, optional items you can switch on or off, tax and a deposit. It shows how many days the quote stays valid.
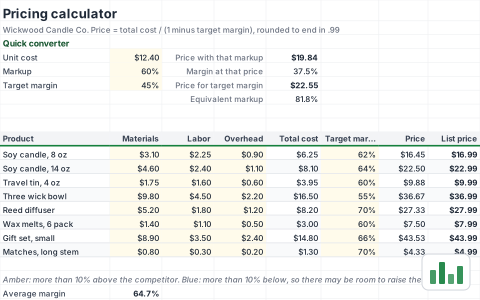 SalesPricing calculatorSet prices from your costs with a target margin, then compare markup, margin and competitor prices per product. A quick converter turns markup into margin and back.
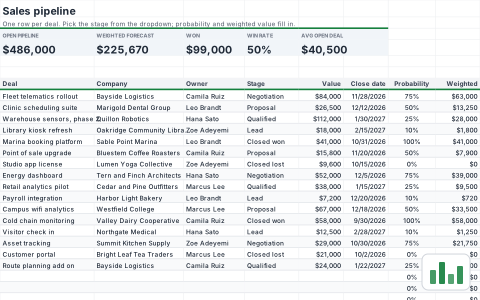 SalesCRM sales pipelineTrack deals by stage with a probability for each stage and a weighted forecast by close month. Late deals and contacts going cold are flagged automatically.
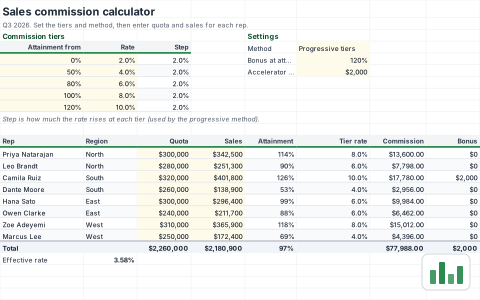 SalesSales commission calculatorPay commission by quota attainment tier, either as one rate on all sales or as progressive tiers. Includes an accelerator bonus and a payout chart by rep.
Start your sales dashboard now
It opens in your browser in a second. Create a free account to save it, share it and open it anywhere.