Finance template
Rental property tracker
Record rent and expenses for each rental in one ledger and get net operating income, cash flow, cap rate and cash on cash return per property.
- Free
- No account needed to try
- Download as .xlsx
What's inside
Everything is a normal workbook once you open it: change the numbers, rename the sheets and make it yours.
2 sheets
- Summary
- Ledger
36 formulasTotals, lookups and checks are already worked out, so the sheet updates as you type. 528 filled cells in all.
Built in
- Charts
- Conditional formatting
- Dropdowns
- Named ranges
- Tables
- Frozen headers
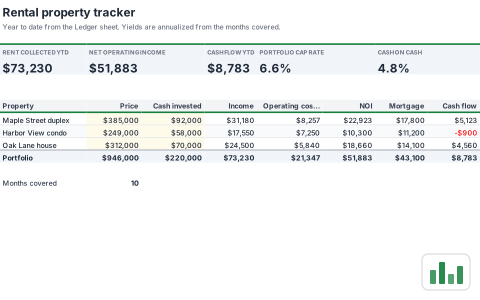
A look at the Summary sheet
The top left of the first sheet, calculated by SheetsBat. Open the template to see all of it.
| A | B | C | D | E | F | G | H | |
|---|---|---|---|---|---|---|---|---|
| 1 | Rental property tracker | |||||||
| 2 | Year to date from the Ledger sheet. Yields are annualized from the months covered. | |||||||
| 3 | ||||||||
| 4 | RENT COLLECTED YTD | NET OPERATING INCOME | CASH FLOW YTD | PORTFOLIO CAP RATE | CASH ON CASH | |||
| 5 | $73,230 | $51,883 | $8,783 | 6.6% | 4.8% | |||
| 6 | ||||||||
| 7 | ||||||||
| 8 | Property | Price | Cash invested | Income | Operating costs | NOI | Mortgage | Cash flow |
| 9 | Maple Street duplex | $385,000 | $92,000 | $31,180 | $8,257 | $22,923 | $17,800 | $5,123 |
| 10 | Harbor View condo | $249,000 | $58,000 | $17,550 | $7,250 | $10,300 | $11,200 | -$900 |
| 11 | Oak Lane house | $312,000 | $70,000 | $24,500 | $5,840 | $18,660 | $14,100 | $4,560 |
| 12 | Portfolio | $946,000 | $220,000 | $73,230 | $21,347 | $51,883 | $43,100 | $8,783 |
- real estate
- rental
- landlord
- cap rate
More finance templates
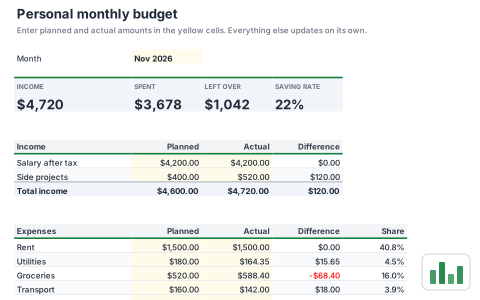 FinancePersonal monthly budgetPlan income and spending for the month and see what is left at a glance. Compare planned and actual amounts by category with a chart.
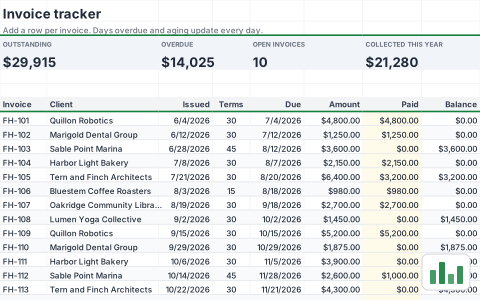 FinanceInvoice trackerTrack every invoice you send, what has been paid and what is overdue today. An aging summary groups open balances by how late they are.
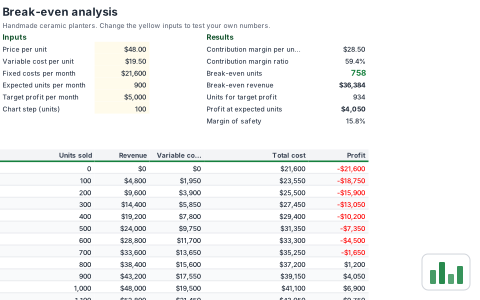 FinanceBreak-even analysisFind how many units you need to sell to cover fixed costs, and what it takes to hit a profit goal. A chart shows revenue crossing total cost.
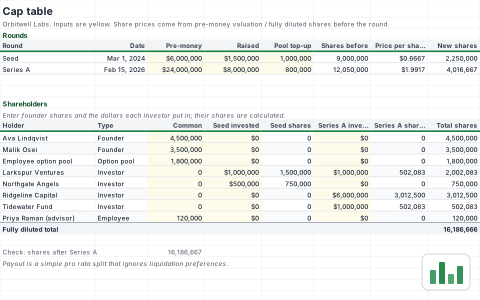 FinanceCap tableModel ownership through seed and Series A rounds with share prices worked out from each pre-money valuation. See fully diluted ownership and a simple payout at an exit value.
Start your rental property tracker now
It opens in your browser in a second. Create a free account to save it, share it and open it anywhere.