Finance template
Investment portfolio tracker
Track holdings with cost basis, market value and gains, then compare your allocation to targets. Rebalancing amounts tell you what to buy or sell.
- Free
- No account needed to try
- Download as .xlsx
What's inside
Everything is a normal workbook once you open it: change the numbers, rename the sheets and make it yours.
1 sheet
- Portfolio
78 formulasTotals, lookups and checks are already worked out, so the sheet updates as you type. 170 filled cells in all.
Built in
- Charts
- Conditional formatting
- Dropdowns
- 1 chart
- 4 conditional format rules
- 1 validation rule
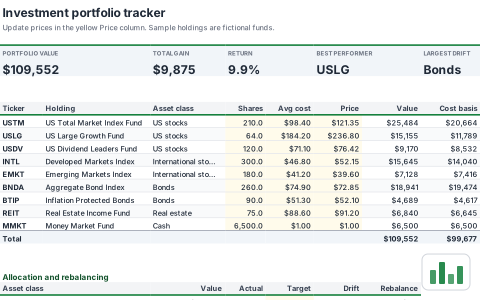
A look at the Portfolio sheet
The top left of the first sheet, calculated by SheetsBat. Open the template to see all of it.
| A | B | C | D | E | F | G | H | |
|---|---|---|---|---|---|---|---|---|
| 1 | Investment portfolio tracker | |||||||
| 2 | Update prices in the yellow Price column. Sample holdings are fictional funds. | |||||||
| 3 | ||||||||
| 4 | PORTFOLIO VALUE | TOTAL GAIN | RETURN | BEST PERFORMER | LARGEST DRIFT | |||
| 5 | $109,552 | $9,875 | 9.9% | USLG | Bonds | |||
| 6 | ||||||||
| 7 | ||||||||
| 8 | Ticker | Holding | Asset class | Shares | Avg cost | Price | Value | Cost basis |
| 9 | USTM | US Total Market Index Fund | US stocks | 210.0 | $98.40 | $121.35 | $25,484 | $20,664 |
| 10 | USLG | US Large Growth Fund | US stocks | 64.0 | $184.20 | $236.80 | $15,155 | $11,789 |
| 11 | USDV | US Dividend Leaders Fund | US stocks | 120.0 | $71.10 | $76.42 | $9,170 | $8,532 |
| 12 | INTL | Developed Markets Index | International stocks | 300.0 | $46.80 | $52.15 | $15,645 | $14,040 |
- investing
- portfolio
- stocks
- allocation
More finance templates
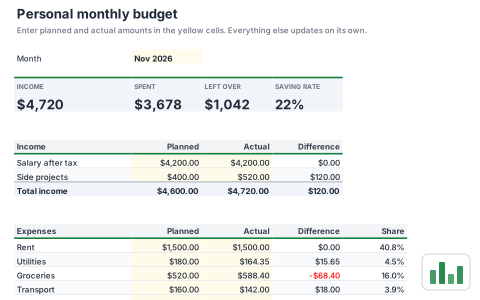 FinancePersonal monthly budgetPlan income and spending for the month and see what is left at a glance. Compare planned and actual amounts by category with a chart.
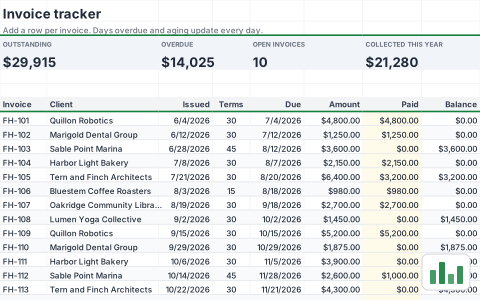 FinanceInvoice trackerTrack every invoice you send, what has been paid and what is overdue today. An aging summary groups open balances by how late they are.
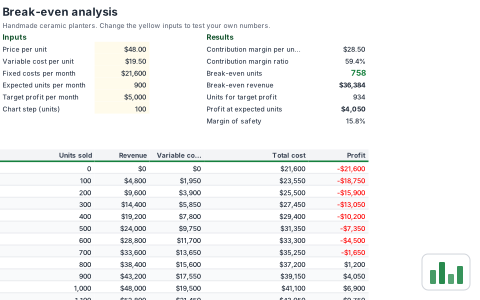 FinanceBreak-even analysisFind how many units you need to sell to cover fixed costs, and what it takes to hit a profit goal. A chart shows revenue crossing total cost.
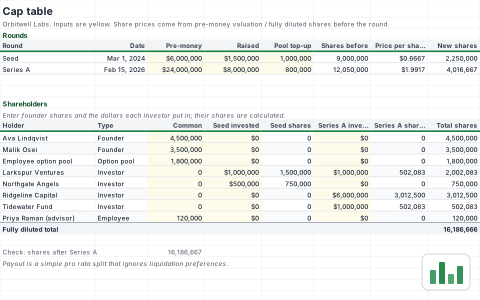 FinanceCap tableModel ownership through seed and Series A rounds with share prices worked out from each pre-money valuation. See fully diluted ownership and a simple payout at an exit value.
Start your investment portfolio tracker now
It opens in your browser in a second. Create a free account to save it, share it and open it anywhere.