Projects template
Gantt chart
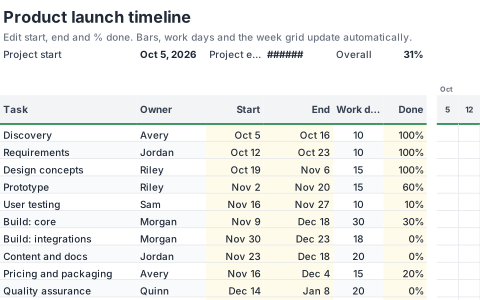
A weekly timeline where bars draw themselves from each task start and end date. The current week is highlighted and progress shades the bar.
- Free
- No account needed to try
- Download as .xlsx
What's inside
Everything is a normal workbook once you open it: change the numbers, rename the sheets and make it yours.
1 sheet
- Timeline
53 formulasTotals, lookups and checks are already worked out, so the sheet updates as you type. 135 filled cells in all.
Built in
- Conditional formatting
- Frozen headers
- 5 conditional format rules
A look at the Timeline sheet
The top left of the first sheet, calculated by SheetsBat. Open the template to see all of it.
| A | B | C | D | E | F | G | H | |
|---|---|---|---|---|---|---|---|---|
| 1 | Product launch timeline | |||||||
| 2 | Edit start, end and % done. Bars, work days and the week grid update automatically. | |||||||
| 3 | Project start | Oct 5, 2026 | Project end | Jan 26, 2027 | Overall | 31% | ||
| 4 | ||||||||
| 5 | Oct | |||||||
| 6 | Task | Owner | Start | End | Work days | Done | 5 | |
| 7 | Discovery | Avery | Oct 5 | Oct 16 | 10 | 100% | ||
| 8 | Requirements | Jordan | Oct 12 | Oct 23 | 10 | 100% | ||
| 9 | Design concepts | Riley | Oct 19 | Nov 6 | 15 | 100% | ||
| 10 | Prototype | Riley | Nov 2 | Nov 20 | 15 | 60% | ||
| 11 | User testing | Sam | Nov 16 | Nov 27 | 10 | 10% | ||
| 12 | Build: core | Morgan | Nov 9 | Dec 18 | 30 | 30% | ||
- gantt
- timeline
- schedule
- project
More projects templates
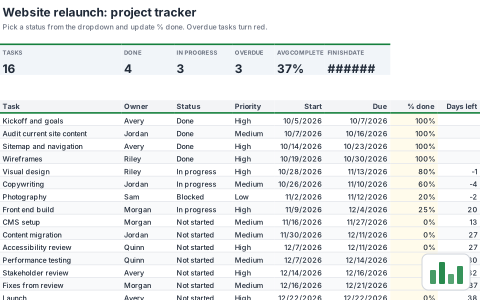 ProjectsProject trackerTrack every task with an owner, status, priority and due date. Overdue work turns red and the summary counts update as you go.
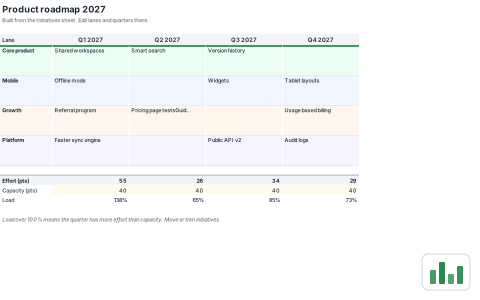 ProjectsProduct roadmapList initiatives once and see them laid out by lane and quarter on a board that builds itself. Capacity checks flag quarters that are overbooked.
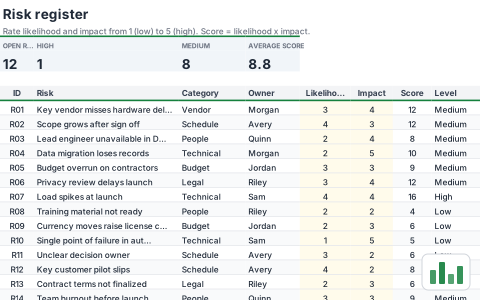 ProjectsRisk registerScore each risk by likelihood and impact, assign an owner and a response. A 5 by 5 heat map counts where the risks sit.
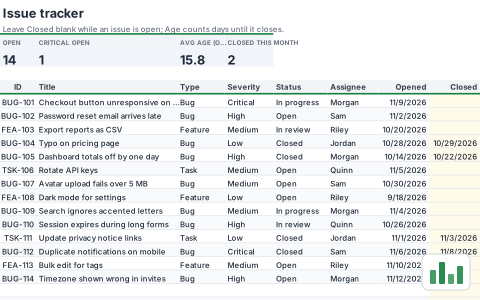 ProjectsIssue and bug trackerLog bugs and requests with severity, status and assignee. Ages count up live and a summary matrix shows open work by severity.
Start your gantt chart now
It opens in your browser in a second. Create a free account to save it, share it and open it anywhere.